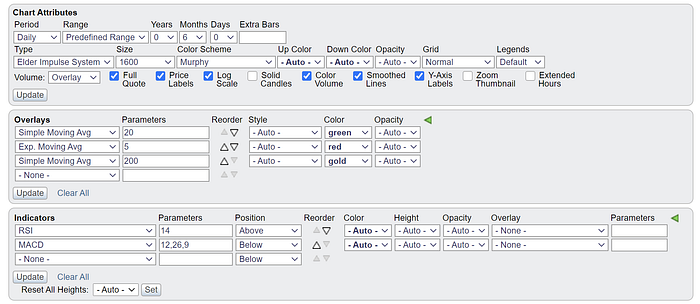
Chart Settings for Stockcharts.com


If you don’t already use Stockchart.com please CLICK HERE to use my referral
These are the settings I use when looking at charts on Stockcharts. I’ll dive into how I use them in a later post, but for now I just want to give you a look under the hood to see what’s what. I’ve broken them down to the main ones that I really use and the optional ones that are just for added confirmation but aren’t my main focus. It’s probably easier to start with the Simple Version, I even find myself going back to the basics more and more because it’s cleaner.
*NOTE: I also use another indicator on Think or Swim, the TMO, that isn’t available on Stockcharts, but I’ve made a whole separate post about that HERE.
Chart Attributes
- Period: Daily — Each bar is one day worth of price movement, notch on the left is opening price, notch on the right is the current/closing price depending if its during market hours or after close
- Time Frame: 6 Months — Gives a wide view of recent price movement
- Type: Elder Impulse System — Colored Bars to show current price trend: Green is Uptrend, Red is Downtrend, Blue is transitional/neutral
Overlays
- Simple Moving Average 20 – Average Price Over the Past 20 Trading Days, GREEN
- Exp. Moving Average 5 – Average Price Over the Past 5 Trading Days with more weight given to recent days, RED
- Simple Moving Average 200 – Average Price Over the Past 200 Trading Days, GOLD
(OPTIONAL)
- Exp. Moving Average 10 — Average Price Over the Past 10 Trading Days with more weight given to recent days, BLUE
- Simple Moving Average 50 – Average Price Over the Past 50 Trading Days, DASHED, BROWN
INDICATORS
- Relative Strength Index (RSI): Shows if stock is Overbought(> 70)
or Oversold (< 30) *positioned ABOVE the chart* - MACD: histogram bars and signal lines that show the momentum of the trend
(OPTIONAL)
- True Strength Index (TSI): signal lines used to determine trend direction
- ADX Line (w/ +DI and -DI): ADX shows strength of the trend, +DI and -DI show the direction of the trend
- Slow Stochastics: momentum indicator that compares closing price to average price over a given period of time
- Average True Range (ATR): Shows the average price movement within the given trading period shown
In addition to these, I also pop over to Think or Swim to check the TMO, which you can read about and download HERE.
UPDATE!
You can now download the SpockTradez chart setup for Think or Swim for the low, low, price of ABSOLUTELY FREE!!!

🖖


