How I Swing Trade
Lesson 2: Planning your exits

*NOTE: This is Lesson 2 in a series, CLICK HERE to read Lesson 1 if you haven’t already
Have you experienced this before? A friend co-worker, or stranger at the gym gives you a hot stock tip. So you buy shares not knowing much about the company, only that the company is gonna be the next big thing and the price is going to the moon! But you have no idea how big or when to cash out and you end up either holding forever, panic selling at the first sign of turbulence, or worse you ride it up and all the way back down again. Well, we’re gonna fix all that so it doesn’t happen again. By the time you’re done with this lesson you’ll be better equipped to maximize your trading.
In the previous lesson I showed you how to find the best time to ENTER a trade. Well that’s great and all, but how do you know when to make your exit and take profits? In this post, I’ll cover how to use Support and Resistance as well as previous price movement to set your Stop Losses and Targets.
To understand where to set a Target and a Stop Loss, we need to understand Support and Resistance. And to understand Support and Resistance we need to learn why price moves…
Why Price Moves
So why does price move? You probably assume if a stock goes up it’s because the company is doing well and if it goes down it’s because they’re doing bad. Well that’s only part of the equation. The truth is there are many reason price moves but I’ll paint a general picture that will broaden your understanding of price movement.
“Each price is the momentary consensus of value of all market participants.”
-Trading for a Living by Dr. Alexander Elder
What does that mean? Basically that everyone trading shares of a given company, both the buyer and sellers, are seeing eye-to-eye on how much that stock is worth. Think about it. For you to buy a stock, someone else has to be willing to sell their shares, right? But if you believe Company X is worth $50, but the seller believes it’s worth $100, well one of you is going to have to reassess their evaluation. However, if the seller find someone else who agrees it’s worth $100, well they’ll sell it to them instead. Likewise, if you find a buyer willing to sell for $50 then that seller will have to come down in price to compete. So the current price is that point where buyers and seller have, at this particular moment in time, come to an agreement of what the stock is worth. Remember this:
Price moves because of fear and greed.
We want to buy when other are fearful and sell when others are greedy!
Once enough traders change their minds about that value, it will cause the price to change. So what factors can change trader’s minds? Here are just a few:
- News or Rumors such as product announcements, company mergers or acquisitions, CEO or other board member changes. (As the adage goes: Buy the rumor, sell the news)
- Earnings Reports which can be good or bad (and trust me price doesn’t always move up on good earnings and down on bad — I still don’t fully get it which is why I avoid trading new positions round earnings calls.
- Lawsuits or Scandals which are never good for business.
- And many more…
When one or more of these factors influences the trader’s view of a company, it changes their evaluation of what that company is worth and how much they’re willing to pay for (or accept for) its stock.
So going back to Company X. If shares are selling at $100, but then bad news breaks that their product is defective or their earning are way lower than expected, well suddenly buyers might not being willing to pay $100 for it. And suddenly seller find themselves in a position to either hold onto it and hope Company X will work out those problems OR they’ll have to take what they can get for it at the moment. So they sell for $90 to some buyer, but let’s say more buyers are still skeptical at that price and will only pay $80 for it, well once all the orders from buyers who would actually pay $90 for are filled, and the only order left are for $80 or below, sellers have to again reassess do they hold or try to sell and get the most that they can at the moment for it? And depending on the majority of sentiment this can keep going until eventually it reaches a point where the sellers will all sort of agree — No, this stock is not worth less than $50 and stop accepting orders for it at anything less than $50. That’s called your Support. It’s the lowest price point that a stock doesn’t go below at a given point in time. Resistance is the exact same thing but in the opposite direction. It’s where price gets so high that buyers all agree the company isn’t worth more than that right now.
Here’s a great real world analogy. Remember what happened last year with toilet paper or hand sanitizer. A roll of TP that normally cost $1 was suddenly going for far more because people wanted it so bad that they’d now pay $2 a roll, but then someone else was so desperate that they’d pay $5, and so on and so forth until eventually someone said, “F that I’m not paying $20 a roll, I’ll use newspaper!” It’s all about supply and demand, which leads into the topic of a stock’s float but we won’t get into that right now.
You might be wondering, “If the charts are telling me stock price is going up why on Earth would anyone sell??” (or vice versa — If it’s going down why would anyone buy?). The reason can be explained with this old chestnut:
“One man’s trash is another man’s treasure.”
What this means is value is subjective. Everyone trades different strategies and may have a different Trading Plan than you. Where you might see a good swing trade setup that will pay off at some point in the next few weeks, another trader might just be day trading the stock and either taking profit because the stock hit their Target or selling because the trade isn’t going in their favor and they’re mitigating their losses. Or maybe the person on the other end isn’t a trader but an investor (yes there’s a difference, I’ll cover that at another time though) and that investor has been holding those shares of Apple stock since the 90s and is cashing out their IRA to retire. Same goes for the other side. You finish out your swing trade and know price is going to drop but the buyer doesn’t care because they’re just slowly accumulating a position in their buy and hold account.
Think of it like buying a home — a young couple might be willing to buy a beachfront house for $1M, knowing that the price will only go up over time. So then why is the current homeowner selling? Well, maybe they bought it at $200K and are about to make $800K on the sale, or maybe they’re just sick of the beach and want to move up to the mountains. The point is you don’t know what’s going on in other people’s heads but you can see its effects based on price movement.
Regardless, there are a number of different reasons people buy and sell stocks and thankfully this is true because if every trader had the same opinion at once no trades would ever happen. Either everyone would be holding and not selling so there would be nothing to buy OR everyone would be trying to dump their stock but nobody is willing to buy.
But I digress. By now your eyes might be glazing over with all the words and numbers so take a break if you need to (don’t worry this article will still be here when you get back from your coffee run).


Are you all caffeinated up? Okay, great! Let’s take a look at what Support and Resistance look like on a chart.
Support & Resistance

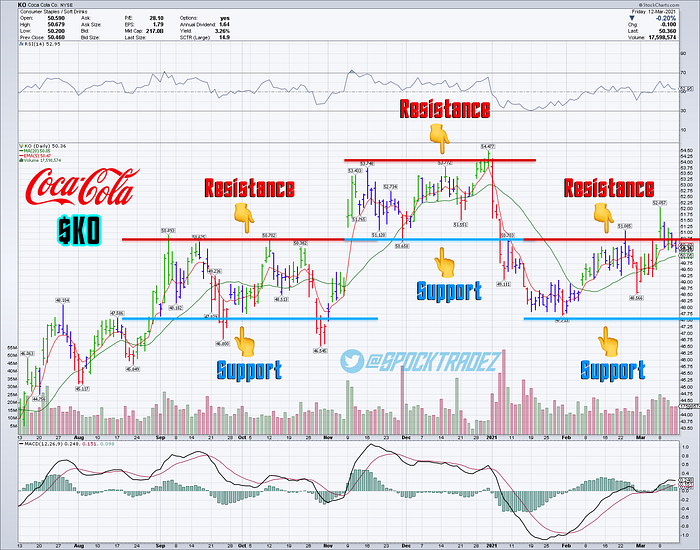
As you can see above, from September to early November Coca-Cola’s stock price was consolidating (moving sideways) now on a day by day analysis the price was moving up and down as buyers and sellers “negotiated” over price. But overall it was really just staying in the same range and when looked at through a wider lens i.e. over a couple of months, you can see it’s just moving sideways.
I feel now is a good time to pause and learn some new words! Traders are usually categorized by their overall view of trading. Traders who are optimistic and believe price will be going up are called Bulls. And traders who believe price will go down are referred to as Bears.

And no, this has nothing to do with Chicago sports teams and the Board of Trade as I first thought (being from Chicago and all).It’s because Bulls attack by swiping UP with their horns (hence traders believe the market will go UP are bullish) and Bears attach by swiping down with their paws (and traders who believe the market will go down are bearish).
Okay, back to Support and Resistance….
Now in that Coca-Cola chart , you’ll notice that during the consolidation period, price stopped moving up every time it got close to $51 and it going lower every time it dropped near $47.75 (there are a few days it dipped below, but as they say science is not an exact science). So these are our Support and Resistance levels. Together this forms what we call “The Box”. Now like I said, during Consolidation, price will move up and down but will pretty much stay within The Box. The Box is where the Bears and Bulls are duking it out for control basically haggling over the price. Eventually one group will win out and price will rise or fall outside of The Box. This is referred to as Breaking Out of the Box. Bullish breakouts usually happen when the 5 EMA crosses the 20 SMA (as we learned about in the previous lesson) and these are exactly what we’re looking for.
An important aspect of Support and Resistance is that once a stock breaks out, the previous Resistance will become Support. Think of it like price being in an apartment building, if it break through the ceiling into the apartment above, what was the ceiling is now the floor. (That’s basically what they are — Support is the floor which supports your weight, and Resistance is the ceiling that keep you from moving up). Same goes for the reverse, if you fall through the floor into the basement, what was the floor (Support) is now the ceiling (Resistance) — I’ve also heard this compared to walking on a frozen lake where the ice breaks and what was the ground (Support) is now preventing you from swimming back up (Resistance)— Don’t believe me? Well take a look…

Pretty crazy right?!! Wanna hear something even crazier??
Price has memory
Wha-wha-What?!
I know what you’re thinking — OMG it’s gone sentient like Skynet!

No it’s nothing like that… at least I don’t think it is. What I mean is that traders opinions of stocks (i.e. their evaluations aka price) tend to repeat. Which is great for us because we can use previous data and patterns to chart what price might do in the future. notice I said might because if it was a guarantee then I wouldn’t be writing a blog I’d be sipping Mai Thais on a my own private island enjoying my life as bajillionaire. But here, let me again show you what I mean:
One other thing that’s important to realize is that when a stock drops (or rises) and breaks through Support (or Resistance) that doesn’t necessarily mean it’s going to be stopped by the next Support (or Resistance) level. If the momentum of that movement is strong enough it might break through the next level as well. Think of it like Juggernaut breaking through wall after wall until it finally loses speed.

Here’s an example of this. In the chart below, $SPOT (Spotify) broke Support and then broke Support again. You can really see this in stock market crashes like March of 2020 or back in 2008 with the housing market crash. But using what we just learned we can find the next level of Support and the next after that and so on by analyzing past price movement and patterns. Eventually Spotify stopped dropping before even reaching he next Support level and then it bounced back up and began forming a new Box in which is now consolidating sideways.

Okay, now I probably impressed you with my mystical prediction skills, but you might be asking yourself, “So how do I use this to my advantage?” We’ll use this newfound knowledge of Support and Resistance to set our price Targets and Stop Losses.
Setting Stop Losses & Targets
Still with me? Okay, great!
So if the Setups we learned in the last lesson are how we determine when to ENTER a trade, our Stop Loss and Target is how we plan to EXIT a trade.
Now as traders, we have to trade the left side of the chart. What does that mean? It means we don’t know what tomorrow will bring. The only data we have it from TODAY going back (to the left of the chart) as many days or years as we set on our chart.
Our task as traders is to study market action, analyze the charts to identify recurring patterns and profit off them.
So now we’ll go step by step and:
- IDENTIFY a good setup
- FIND previous Support and Resistance levels
- DETERMINE our Stop Loss and Targets
I guess I should explain what a Stop Loss is. It’s basically your safety net. It’s the price you set where if a stock drops below that number it’ll automatically sell and save you from further losses. One of the major rules of trading is:
Never move your Stops DOWN, only move them UP!
For this example I’m going to use the chart for Best Buy ($BBY) which signaled on Friday when Price broke above the 20:

STEP #1 — We identify that this is a good setup. We have price closing above the 20 SMA and good upward momentum on the MACD Histogram as well as the MACD crossing up into the positive (notice both the histogram bars are now above zero AND the black MACD line has crossed the red Signal Line).

STEP #2 — We look at past data to find our Support and Resistance patterns. I’ve gone a little overboard here just to illustrate to you where the Support and Resistance levels are and when price broke above or below them how old Support becomes new Resistance.
*NOTE: I never make it this complicated, but I did this just for the lesson. In reality, I would just look at it like this:

Once you get more practiced at this, you won’t even need to draw lines at all, you’ll just immediately see the levels.
Now that we’ve identified Support and Resistance, let’s find out Stop Loss and price Targets…

STEP #3 — From what we learned by finding the current Support and Resistance, we now know the limits of The Box that price is currently trading within as shown above.

Above we can see the various Boxes $BBY has traded within during consolidation periods. Note the large one from mid-Oct to the end of Nov. When a stocks traded erratically up and down like this, you don’t want to touch it, it’s too choppy and unpredictable to trade.
Now since we don’t want to get shaken out of the trade by normal daily up and down price movement, we want to set our Stop Loss just below that Support level. That way if price breaks down through Support, it’ll trigger our Stop Loss and automatically sell before it drops to the next Support level. So by looking at the patterns of Support at this level, we can determine the Stop should be set around $105.50 — Now I say around because it’s not an exact science. You can set it wider if you’re comfortable taking more risk or you can set it tighter if you’re not — This can vary depending on what you use as your bottom Support level. I’m going off of the fact that price bottomed out at $105.65 on Tuesday (the blue bar) but you might go back to where previous Resistance was in December and use that $105.29 high as your reference point. You’ll get better at determining what level works for you the more you trade and get used to reading the charts.

So now that we have our Stop Loss set, let’s find our price Targets. To do this we want to look and see where price has gone up to before, let’s simplify our simple chart from before…

We look for previous Resistance because this is where price might go up to, hit that same area, and bounce back down until it builds up enough momentum to break back through it (or drop through Support if the trend reverses before it manages to). I tend to be conservative with my Targets, so I like to find an price that the stock has hit a few times rather than the one anomaly of the highest price in the range.
*NOTE: I’ll also check TipRanks and Morningstar to see what price evaluations other analysts have for the stock.

For Example, as of today, TipRanks has an average price target of $116.42 for $BBY and a High target of $150.00

Whereas Morningstar has it at a $98.00 Fair Value — BUT notice that was last adjusted on Nov 30th, 2020. Therefore, I’d use the TipRanks info but ignore the Morningstar valuation.
So for this $BBY chart, I would set my 1st Target at $115.75 to increase the likelihood of it hitting that price. For my 2nd Target, rather than set it at the ATH (all time high) of $124.21 or recent high of $123.30, I’ll set it at $122.55 which has a better chance of hitting. You can determine how much profit you want to try and squeeze out of a position, but I’d rather have my Target hit than risk it just barely missing to make a few extra bucks. (Trust me, you’ll experience the pain of this at some point but remember, leave emotions at the door and TRADE LIKE SPOCK!). And never forget one of the major rules of trading: Never get upset about leaving money on the table. Be happy with the gains you did take. A win is a win! 🤑

Moving Up Your Stops
One thing you’ll want to be sure to do is move your Stops UP as the trade moves in your favor. This will ensure that you protect your profits.
Now, just like when we set a Stop Loss the first time, you want to give the trade enough room to handle normal daily price movement. So where do we move it to then? Well as price breaks out of the box we can move it up to the next level. Like two people climbing a ladder together. One is always above the other.
The first level you’ll move your S/L up to is the break even point, which is your initial entry price. This guarantees that if the trade turns against you, you’ll at least walk away with without a loss. So for example, when price triggers the 1st Target, we move our S/L up to break even. When the price hits our 2nd Target we move the S/L up to the 1st Target which now guarantees that if the trend reverse we walk away with our gains. Again, we do this to protect our profits.
Let me take this moment to remind you of the #1 Rule for Stops…
Never move your Stops DOWN, only move them UP!
Using Conditional Orders
After a trade I like to immediately setup a Conditional Order — basically it’s an order that says if A happens do THIS but if B happens do THAT. The type of Conditional Order that I use is an OCO order (One Cancels the Other) — sometimes referred to as OCA order (One Cancels Another).
An OCO order works like this: If A happens do THIS (and cancel B) but if B happens do THAT (and cancel A). We can use an OCO order to place both our Stop Loss and Target orders AT THE SAME TIME!

Amazing right?! So basically with an OCO order you’re telling your broker, “Hey if $BBY hits $105.50 go ahead and sell cuz this trade ain’t working BUT if it hits $115.75 go ahead and sell cuz I wanna take some profits!”
And what’s great is that you can set multiple OCO orders for the same stock. So let’s say you have 60 Shares of $BBY and you want to break up your position into thirds… You’d set one OCO order to sell 20 shares at the 1st Target and Stop Loss, and another OCO order to sell 20 shares at the 2nd Target with the same Stop Loss, and hold onto the last 20 in case the price keeps running up (but be sure to set a regular Stop Loss for those shares as well, unless you want to keep a core position even if it goes below your stop).
I like using OCO orders to automate as much of this process as possible (call me lazy, but I got other things to do than watch charts all day). That way I don’t have to worry about checking my computer or phone so I don’t miss an opportunity to sell, I’ve already taken care of it and can let my trading system do its job. And remember, no matter if the price hits your Target for a gain or your Stop Loss for a loss, either way it’s a successful trade because your system did exactly what it was supposed to. As they say…
“A losing trade is not always a bad trade and a winning trade is not always a good trade.”
I know that sounds weird, how is a winning trade not a good trade?? If there’s no plan, just because you made money doesn’t mean it’s a good trade, a profitable trade sure, but not a good trade. For example, if you buy GameStop ($GME) right now and it makes money. Sure it’s profitable but that’s not a good trade, it’s just gambling. There’s no system there, you’re just throwing your money into the hype and hoping for the best. Even a broken clock is right twice a day, that doesn’t mean it’s a good clock.
How to set an OCO Order
Setting an OCO order might vary depending on what trading platform you use, but it will generally look the same.
Here’s what our OCO order for $BBY would look like on Fidelity…

And here’s what it would look like on TD Ameritrade (they call it an OCA order but it’s the same thing).

Notice that Fidelity calls it a Stop Loss and TD Ameritrade calls it a Stop Market. These are the same thing. It just means if price goes under this number to sell. NOTE: Due to slippage your stock might actually sell at a price lower than what you set.
There are other types of Stops like a Stop Limit order which only sell at EXACTLY the price you set, but if that price doesn’t hit exactly, you might be stuck holding the stock if it continues to fall.
For example, if price drops AH (After Hours) below your Stop Limit price (stops don’t trigger in After Hours periods) and opens the next day under your Stop Limit it won’t sell at all and could continue to fall. Whereas if you had a Stop Loss (aka Stop Market) order and price opened below your S/L then it would immediately sell at whatever price it can get to protect you from further losses.
There are also Trailing Stop Losses which will automatically move up when the price moves up based on a percent or dollar amount that you set. I’m experimenting with these to further automate my trading process — as I tend to forget to move my Stops up in order to protect my gains — but I’ll get more into those in another post, but let me take this moment to reiterate the #1 Rule for Stops yet again…
Never move your Stops DOWN, only move them UP!
There’s no point in having Stops if you’re gonna move them down. That defeats the purpose of protective stops. It’s a dumb and a total amateur move. Stops are your safety net. If you were walking on a trapeze wire and had a safety net you wouldn’t keep lowering it until it was laying on the ground would you? No, you wouldn’t. And you should treat your Stops the same way.
Other Exit Points
There’s a few other points of when I take some profits or close out a trade completely which I’ll quickly discuss.
RSI Over 70
The RSI (Relative Strength Index) indicates when a stock is Overbought (above 70) or Oversold (under 30). When it’s Overbought, it’s not long after that price begins to drop and come back down to a reasonable price after the frenzy of trading and hype dies down. This is a signal to take some profits.

Now as you’ll notice in the above chart for Virgin Galactic ($SPCE), it’s always not immediate. A stock can go well above 70 RSI and even stay up there for a while, but sooner or later it always dips back down. Using this indicator we can sell a portion of our position to ensure we take some profits before it drops. I’ll cover this more in a lesson about indicators.
TMO Flipping Red
Likewise, I use the TMO (True Momentum Oscillator) much the same way. But often I will use this to complete exit a trade. Just like the RSI, the TMO has a top zone (Red bar at top) and a bottom zone (green bar at the bottom) that it moves or oscillates between. The color of the lines shows the direction of the trend (up or down). And the thickness created by the distance between those bars shows the strength of that trend (thick is strong, thing is weak).

As you can see above with $SPCE, just like the RSI, this is not a perfect indicator but it’s pretty damn good and can help you exit before your S/L is hit or take profits before a trend reverses even if it hasn’t hit your Target yet.
Both of these indicators require you to be looking at charts, so it’s not part of a automated system, but as of right now I don’t think we can go fully automated just yet. Maybe someday tho!
Breakdowns
The same way we used indicator to know when a stock is breaking out, we can use them to see when price is breaking down and the trend is reversing. It’s basically just the inverse of a breakout…
- Price closes BELOW the 20 SMA — The early warning sign to look for is price closing below it’s 20 day Simple Moving Average.
- The 20/5 Crossover — The next warning sign is the 20 SMA crossing above the 5 EMA.

Just as I mentioned before, these can sometimes occur on the same day. If you haven’t hit your Target yet (or hit 1st Target but hasn’t hit the 2nd Target), this signal can be used to exit a position and retain your gains. If you know the trend is reversing, it’s smart to get out early rather than ride the price down to your Stop Loss. Always try to protect your profits!
*NOTE: I’ll get into a way to stay on top of these breakdowns with a post about using Stockcharts’ Alerts.
That wraps up Lesson 2. Let this all simmer for a bit, then check out Lesson 3 where I’ll discuss Risk Management and position sizing.
Til then… Trade long and prosper!
🖖