The Wind 🌬️
Looking at the big picture!

“We cannot direct the wind, but we can adjust the sails!”
The Market has been rough sailing these past few weeks and it can feel hard to navigate at times. So today I’m going to cover an essential habit to get into (one that I’m working on being better at myself) and that’s taking a step back from looking at a specific stock and looking at the bigger picture of the entire market Market.

To do this, we look at the indexes, or as Gerald Peters refers to it, “The Wind.” Just as a sailor uses the wind to set their course in order to reach their destination, we as traders need to check out own “wind” to navigate the waves of the Market. To do this, we use the same chart analysis as regular stocks but we look at the indexes. such as the S&P 500 or the Dow Jones.

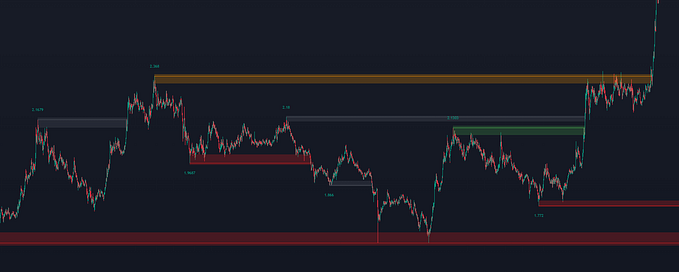
If you don’t already use Stockchart.com please CLICK HERE to use my referral
- $SPY — We use this chart to track the S&P 500, which are 500 of the largest companies on the stock market.
- $QQQ — We use this chart to track the Nasdaq, which is basically all the tech stocks.
- $DIA — Tracks the Dow Jones Industrial Average or simply “the Dow” which is 30 large companies listed on U.S. exchanges.
(There’s a whole investing strategy called “The Dogs of the Dow” that I’ll talk about in a later post) - $BRENT — This chart tracks the price of crude oil.
- $TLT — Tracks bonds.
- $GLD — Tacks the price of gold.
- $GBTC — Tracks bitcoin.
- $ETHE — Tracks Ethereum.
We can analyze the above charts to see the overall trend direction of the individual indexes. We use the same analysis techniques we learned in Lesson 1 to read the charts and see if an index is in an uptrend or a downtrend.
Reading The Wind will help keep your trades sailing smoothly.
For example, if you see that the price of crude oil ($BRENT) is going up, you’ll know that spotting any breakouts in charts like Exxon Mobil ($XOM), Chevron ($CVX), and BP ($BP) are especially good setups.


See how in sync these are? Using The Wind as your guide can help you decide whether to stay in a trade or not.
Look at $XOM in late December where the 5 EMA dropped below the 20 SMA. Normally, this would signal for you to exit a trade, but looking at the crude oil index $BRENT we can see that oil in a steady uptrend, so it might be worth waiting to see if $XOM is truly in a downtrend or just experiencing a dip.


Now if you look at the past few weeks in March, you’ll see $XOM again experiencing a price drop where the 5 crosses below the 20 but this time, $BRENT is also experiencing the same drop telling us this isn’t just a dip, but a downtrend. The Wind is telling us money is moving out of the oil sector and going somewhere else. This is called sector rotation, but more on that below.
Notes About The Wind
Movement in certain areas can cue upcoming movement in others. For instance, when people get scared of Market volatility (downtrend in the $SPY or $DIA), they tend to move their money into more stable positions such as gold ($GLD)and bonds ($TLT)and vice versa when the Market bounces back and is on an uptrend. Another one is that when the Market goes crazy, big money tends to move to the defense sectors like Oil and Real Estate stocks, and then back out when things eventually settle down. Although lately, a lot of these Market truisms haven’t been accurate — a product of the craziness of our current uncertain times caused by both the pandemic and an onslaught of new retail traders.

Monitoring Volatility
There are some other signs of an approaching storm i.e. market volatility:
“Volatility represents how large an asset’s prices swing around the mean price — it is a statistical measure of its dispersion of returns. In most cases, the higher the volatility, the riskier the security.
- $VIX — tracks the volatility of the S&P 500
- $VXN— tracks the volatility of the Nasdaq
Let’s look at how volatility indexes can help you foresee troubled waters ahead…

If you don’t already use Stockchart.com please CLICK HERE to use my referral

Above, we can see the chart for the $QQQ representing the Nasdaq which dropped heavily in the past few weeks. Below it, is the $VXN which is the volatility of the Nasdaq.
You’ll notice that the charts are basically the inverse of each other. When the $QQQ goes down the $VXN goes up. By keeping an eye on the $VXN, we can see what the condition of the index is.
So when the $VXN has a 5/20 Crossover, it’s signaling that the market is especially volatile and it might be best to stay away from Tech stocks til things calm down.
*NOTE: this doesn’t mean all the tech stocks are going down, just that area in general, there’s always outliers, it’s more of signal to trade with caution.
The reverse is also true. When the $VXN goes breaks down (a 20/5 Crossover) it a signal that the Nasdaq might be settling down and less volatile.
Hedging Your Positions
Shorting without shorting

You’ll sometimes hear traders or analysts say they are “long” or “short” a stock. Basically long means they’re in that trade believing that the price will go up and they’ll make a profit. You’ll remember that these traders are known as bulls. If a trader says they have a short position on a stock, they believe the price will go down in the future and use a technique called short selling to make a profit. These traders you’ll recall are referred to as bears.
Short selling — a trading strategy wherein the trader believes a stock’s price will go down in the future. Therefore, they borrow shares of that stock to be returned later plus an interest payment. The trader sells that stock, then, if they’re right, buys the stocks back at a lower price and returns the stock to the original owner with the interest and pockets the profits. It’s a very risky strategy and should only be done by advanced, experienced, traders.
When the Market is in a downtrend that means the bears are in control so shorting is an obvious way to make money in that environment. But shorting is something I haven’t gotten into yet, and I may never. BUT if you want short the Market without the process of borrowing shares etc… you can trade ETFs that correspond to the inverse of the indexes and let them do the work for you!
For example, the $SQQQ is the inverse of the $QQQ. You trade it like a normal stock or ETF, but when the actual index goes down, its price goes up!

Watching Sectors

As I mentioned earlier, big money tends to make moves through different Sectors of the Market. To keep your finger on the pulse of where the money is at and where it’s going should be high on your priority list.
Stockcharts has a really cool interface for checking out Sectors. It works kinda like folders on your computer, that have sub-folders inside them and you can keep digging deeper and getting more specific. Like changing the lenses on a microscope to get a closer look.
If you don’t already use Stockchart.com please CLICK HERE to use my referral

Above is the Sector Summary page from Stockcharts. They are listed in order of largest percent change to smallest (for a quick assessment you can just glance at the green and red color bars on the right). All of those sector tickers can be charted like a normal stock, see the below chart for the Tech Sector ($XLK)…

If you click on any of those sector names it will open up a list of Industries which are more specific sub-sectors within that main sector. Below is the list of Industries/sub-sectors in the Technology Sector ($XLK)….

Again, you can take any of those tickers and chart them for analysis like you would a stock. Looking for 5/20 Crossovers, high RSIs over 70, etc…
If you click on any of those Industry labels, it will open another list of stocks within that sub-sector. Below is the list of stocks in the Renewable Energy Equipment industry…

Again, this of these like folder on your computer, the deeper you dig, the more specific the area you’re looking at. All are shown in the order of biggest change to lowest or negative change, with green and red colored bars displaying how much they have changed today.

Conclusion
Get in the habit of making your first task of the trading day to check The Wind to see which way it’s blowing. This will help you set a course for the day’s trading and hopefully make smarter, more educated trades. Keep an eye on the Sectors as well and be aware of Sector Rotation. When one sector is getting hammered by the storm, there’s usually one or two others that are cruising through calmer waters. Checking both The Wind and Sector Summaries are valuable assets in your toolbox, be sure to use them, and use them often.
Trade long and prosper!
🖖