Stock Scans & Alerts
Finding setups the easy way!

By now I’m sure you’re wondering…
“Okay, so I know how to spot a good setup now, but how do I find them??”
When I first started trading I wasn’t sure how to find good setups either. I already discussed in a previous post about how to find stocks (Hint: they’re all around you!). so as I got more and more tickers I began by creating watchlists for various sectors and themes — like airlines, consumer goods, oil companies, tech etc… From there, I was literally spending every morning going chart by chart looking at the moving averages and price in search of good setups. Needless to say, this ate up a lot of time and was a lot of work. And as I’ve mentioned many times before, I’m lazy and want to make my trading as automated as possible. I thought to myself, “There has to be a better way!”

And there is a better way!! — Stock Scans!
Stock Scans allow you to set certain parameters and search through the markets for any stocks that fit your desired criteria. It’s like Googling for setups!
Eventually, I combined all of the stocks from my individual sector watchlists into a MASTER WATCHLIST. This master list is always growing and whenever I find a new stock I like, I add it to the list.
From there I created a series of Scans and Alerts to focus only on that list. This filters out a lot of the noise from junk penny stocks and keeps the search results list manageable. And now I only have to check whatever stocks pop up on my radar in my Alert emails at Market close everyday. This saves me so much time and really streamlines my process. When I find a setup I like, I’ll either enter a position in the After Hours trading or put in a buy order for the next trading day.
I’m going to walk you through the main Scans and Alerts I use on Stockcharts to scan my Master Watchlist. I’m going to put these notes about the codes right here at the beginning so I don’t have to repeat it with every description below —
- If you DO want to scan the entire Market, simply remove the line that says… and [favorites list is 62] // * MASTER WATCH LIST *
this is what focuses the scan to limit the results to only the watchlist you’ve indicated, but be warned, the list will be a lot longer! - DON’T use the exact code I use for my Master Watchlist line because your chart number probably won’t be the same — even if you match the watchlist name exactly (i.e. your Master Watchlist will probably have a different number depending on how many list you made already, the number is important, the name is not — mine just happens to be 62).
It’s best to manually add the watchlist you built using the Scan/Alert Components options(pictured below):

If you don’t already use Stockchart.com please CLICK HERE to use my referral
ALERTS vs SCANS

Okay, you’ve probably noticed I’ve been referring to both Scans and Alerts. So what’s the difference??
As far as the code is concerned, nothing!
On Stockcharts they work exactly the same. The only difference is when writing them. When you’re in the workbench for Scans the code text is color coded and it shows you possible code options as your type. For some reason the Alert Workbench doesn’t do this. So when starting out it might be best to begin using the Scan Workbench and copy the code over to an Alert when you’re done. I have all of mine in both Scan and Alert form.
But basically a Scan is a search that you run manually and an Alert is something that gets triggered and automagically sends you an email or text message.
Since Alerts are automatic, they need additional information from you about when to notify you and what to do after the alert is triggered. I’ve made up some names for these fields and describe their options below:
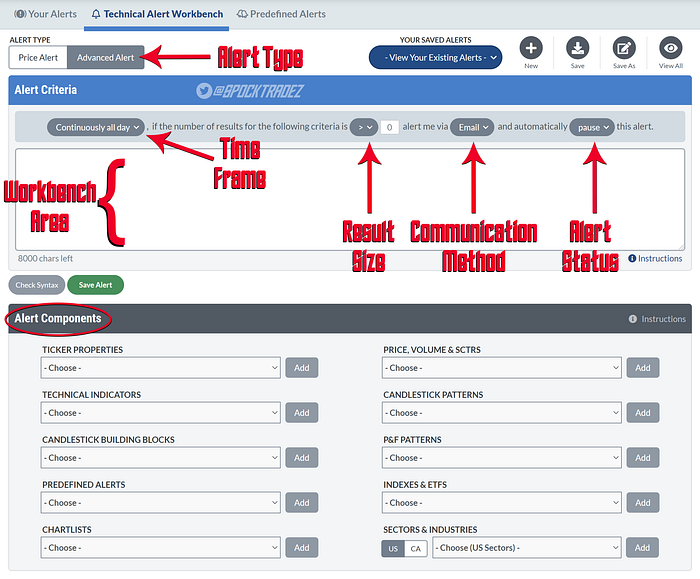
- ALERT TYPE: To write your own codes that are more complex, make sure you’re in the Advanced Alert workbench menu.
- TIME FRAME: When do you want to be alerted? These are pretty straightforward, I always set mine to At Market Close because that’s what’s important to me. I like getting a digest of everything at the end of the trading day. The only ones that I set for Continuously All Day are the two Warning Alerts I describe below. Just be aware, Continuously and Hourly can result in a lot of messages in your inbox!
- RESULTS SIZE: Since I have my alerts set for At Market Close, I have this set to Greater Than Zero (>0) that way it only sends me an alert if there’s at least one stock on the list. But if you have a different preference by all means go with that.
- COMMUNICATION METHOD: I prefer Email but you can also select SMS Text Messages to get them on your phone or Workbench which keeps the alert inside the Stockcharts website.
- ALERT STATUS: I have this set for Continuous, that way it keeps the alert going every trading day. If you use Pause you’ll have to re-activate it if you want it to be looking out for your criteria again. But if you’re writing an alert to say, watch one specific stock or something, you can have it Delete after it alerts you, which will keep your alerts menus nice and tidy (but don’t forget to backup your custom code somewhere, because there’s no trash bin to retrieve it from).
- WORKBENCH AREA: This is where you write (or paste) your code. To keep it clean and easy to read, I make a new line for each parameter. I’ll include some other notes about coding in case you want to branch out and add parameters I don’t have listed in this post.
Whether you’re making a Scan or an Alert, click New and remember to Name and Save it. Depending on what level account you have with Stockcharts, you might have a limited number that you can have at a time (For example, I can only have 10 Alerts with my EXTRA level account).
If you don’t already use Stockchart.com please CLICK HERE to use my referral
All of these Scans/Alerts are based on the setups I discussed in How I Swing Trade: Lesson 1 — How to spot good stock setups. Again, the code is the same whether it’s for a Scan or an Alert.
BUY ALERTS/SCANS

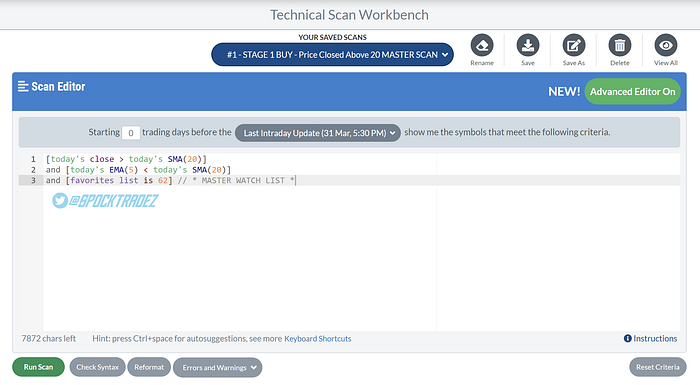
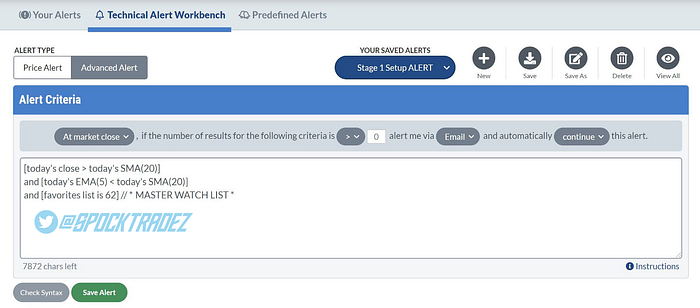
Stage 1 – Price Closed Above the 20
This code will search for stocks where:
- Today’s close is above the current 20 SMA
- AND where the current 5EMA is still below the 20 SMA
- AND it will only look on my Master Watchlist
[today’s close > today’s SMA(20)]
and [today’s EMA(5) < today’s SMA(20)]
and [favorites list is 62] // * MASTER WATCH LIST *
Stage 2 – 5/20 Crossover
This code will search for stocks where:
- Today the 5 EMA crossed above the 20 SMA
- AND it will only look on my Master Watchlist
[today’s daily EMA(5) x today’s daily SMA(20)]
and [favorites list is 62] // * MASTER WATCH LIST *
Oversold — Under 30 RSI
This code will search for stocks where:
- The RSI is below 30 (*NOTE: I recently moved this up to 31 because some stocks bounce off the 30 but are still a great deal)
- AND it will only look on my Master Watchlist
[RSI(14) < 30.0]
and [favorites list is 62] // * MASTER WATCH LIST *

SELL ALERTS/SCANS

Stage 3 - Price Closed Below the 20
This code will search for stocks where:
- The current 5EMA is still above the 20 SMA
- AND Today’s close is below the current 20 SMA
- AND it will only look on my Master Watchlist
[today’s EMA(5) > today’s SMA(20)]
and
and [favorites list is 62] // * MASTER WATCH LIST *
Stage 4 - 20/5 Crossover
This code will search for stocks where:
- Today the 20 SMA crossed above the 5 EMA
- AND it will only look on my Master Watchlist
[today’s daily SMA(20) x today’s daily EMA(5)]
and [favorites list is 62] // * MASTER WATCH LIST *
Overbought- Over 70 RSI
This code will search for stocks where:
- The RSI is above 70
- AND it will only look on my Master Watchlist
[RSI(14) > 70.0]
and [favorites list is 62] // * MASTER WATCH LIST *
WARNING ALERTS

Volatility Warnings
**NOTE: These two alerts are the only ones I have set to Continuous buuuut I probably really only need them to be set for At Market Close since that’s what really matters.
This code will alert you when the $VIX volatility index:
- Is above the current 20 SMA
- AND where the current 5EMA is still below the 20 SMA
- AND it will only look on my Master Watchlist
[symbol = “$VIX”]
and [today’s close > today’s SMA(20)]
and [today’s EMA(5) < today’s SMA(20)]
And this is the exact same but for the $VXN:
[symbol = “$VXN”]
and [today’s close > today’s SMA(20)]
and [today’s EMA(5) < today’s SMA(20)]
CURRENT HOLDINGS WARNINGS
I also like keeping a watchlist for the stocks I’m currently holding in my trading account. In Lesson 2: Planning your Exits, we learned how to set OCO orders for our Targets and Stop Losses but one thing we can’t set them for is when we want to take profits if the RSI goes above 70 and when to exit a trade if the trend reverses. Again, I’m lazy and want to automate my trading as much as possible so I made these Alerts to tell me when positions are ripe for those other exits.
This one alerts me if any stocks I’m holding go above 70 RSI:
[RSI(14) > 70.0]
and [favorites list is 58] // * My HOLDINGS list *
And this code will alert me when stocks in my holdings breakdown and signal a Stage 4 decline* is coming:
- The current 5EMA is still above the 20 SMA
- AND Today’s close is below the current 20 SMA
- AND it will only look on my Holdings Watchlist (Notice the number is different than my Master Watchlist?)
[today’s EMA(5) > today’s SMA(20)]
and [today’s close < today’s SMA(20)]
and [favorites list is 58] // * My HOLDINGS list *
*More on the 4 Stages of Price Movement is an upcoming post
EXPERIMENTAL ALERTS/SCANS

Here are a couple of other codes I’ve been experimenting with to find potential setups even earlier (like right after a Stage 4 decline*) to just nibble on the stock and take a small, starting position so I don’t miss the breakout if it happens suddenly. I’d say wait to try these until you master the basic setups because these are much riskier and I’m still playing with the code to see what ind of results I get. If I find a code I feel delivers good results more often than not, I’ll post an update, but as of now these are strictly “Use at your own risk!”
Price Moved (but didn’t Close) Above the 20
This code basically looks for stocks where the price went above the 20 SMA but didn’t close above it, like it’s testing it. I’m thinking that could be a sign that the Stage 1 breakout could be following soon:
[today’s EMA(5) < today’s SMA(20)]
and [today’s High > today’s SMA(20)]
and [today’s close < today’s SMA(20)]
and [yesterday’s close < yesterday’s SMA(20)]
and [favorites list is 62] // * MASTER WATCH LIST *
Price Found Support and the MACD Momentum Turned Upward
This one is a little more complicated. I’m trying to find a way to search for stocks that found support for a few days and the MACD reversed into upward momentum. For now I’m using the Elder Bar colors as “Support” but ideally I’ll find a better solution soon.
[today’s EMA(5) < today’s SMA(20)]
and [today’s MACD Hist(12,26,9) > yesterday’s MACD Hist(12,26,9)]
and [today’s Elder Bar Red is false]
and [yesterday’s Elder Bar Red is false]
and [today’s close > yesterday’s close]
and [today’s close < today’s EMA(10)]
and [favorites list is 62] // * MASTER WATCH LIST *
CODING NOTES

Lastly, I want to include some helpful notes on writing code for those of you that want to experiment with your own formulas.
If you create something good, I encourage you to post it in the comments!! We’re all in this together 🤝

Scans aren’t quite as easy on Stockcharts as they are on say Think or Swim or Finviz, which give you dropdown menu options, but don’t let that scare you off. I’m gonna show you the ropes and you’ll be creating your own Scans in no time!
The “easy way” to build code is using the Scan/Alert Components options I mentioned earlier when adding your Master Watchlist. But you can also write these by hand once you get more familiar with the parameters. So for those brave souls, I’ve put together a little guide on basics to get you started…

As I mentioned before, the Scan and Alert codes are the same but the Workbenches behave slightly differently. When you’re in the workbench for Scans the code text is color coded and it shows you possible code options as your type. For some reason the Alert Workbench doesn’t do this.
So when starting out it might be best to begin using the Scan Workbench and copy the code over to an Alert when you’re done. I have all of mine in both Scan and Alert form.
CODING BASICS
In general, you’ll want to only have one line of code per line. This allows you to keep track of what the code is doing easier than if it’s all messy with five instructions on one line.
[ ]
Parameters will need to be enclosed in brackets and function the same way you learned in your high school algebra class. A Missing bracket can confuse the computer so be sure to continually “Check Syntax” to check your code.
//
This tells the computer to ignore this line, which allows you to leave yourself notes about the code
Here’s a few simple parameters that I haven’t mentioned much or at all above:
Symbol
Basically it’s the ticker. You can use this code to specify say an Alert to only watch a specific stock. Everything you write in this code will only be applied to this specific ticker. Just place the ticker letters within the quotation marks.
Example for Apple Computers: [symbol = “AAPL”]
Type
What type of security are you looking for?
Example: [type = stock]
Country
You can narrow your search by stocks from specific countries with this code:
Example: [country is US]
Exchange
You can also limit your search to certain exchanges, this example shows how to add a parameter to only search for stocks listed on the New York Stock Exchange.
Example: [exchange is NYSE]
Price
This parameter searches for a price and uses the comparison symbols listed below. For example, if you want an Alert or a Scan for stocks where the price Closed above $110.
Example: [Close > 110]
LOGIC OPERATORS
Basically just fancy word for conjunctions to connect the parameters into one search. Since we’re only putting one parameter per line, you’ll use them to start new lines.
and
This adds an additional parameter to your code (like when you want to find the “5 crossing the 20” AND “only search my watchlist”).
or
This is if you have two parameters and you want to see results for either one.
Thinks of of them like, “This and That” or “This or That.” I haven’t tried it but you might also be able to use not, like “This not That” to exclude things from your search.
COMPARISON SYMBOLS & PHRASES
To compare two things we can use symbols or phrases. You saw this above when we wanted to look for the Today’s price being greater than the 20 SMA. Here’s the full list of symbols for comparing numerical attributes:
- = (equals)
- < (less than)
- <= (less than or equal to)
- > (greater than)
- >= (greater than or equal to)
- != (not equal to)
- x (crosses above) — NOTE: there’s no crosses below symbol, that’s why I reversed the language of the breakdown crossovers to say 20 crossed above the 5 and not the 5 crossing below the 20
Similar phrases versions are for used text comparisons:
- is
- is not
- contains
- not contains
- starts with
- ends with
ARITHMETIC OPERATORS
That’s a fancy way to say your basic math symbols!
- + (Plus)
- - (Minus)
- * (Multiplied By)
- / (Divided By)
TIME INTERVALS
These are used to compare attributed from different days. Like when I wanted to add an attribute where Today’s MACD was higher than Yesterday’s MACD to look for an uptrend. Today is the default option if you do not indicate a time interval, but here are some other options you can use:
- today’s
- yesterday’s
- n days ago (e.g. 3 days ago)
- this week’s
- last week’s
- n weeks ago (e.g. 2 weeks ago)
- this month’s
- last month’s
- n months ago (e.g. 4 months ago)
Example: [today’s MACD Hist(12,26,9) > yesterday’s MACD Hist(12,26,9)]
You can also modify any of the parameters with different time frames — the same way we can look at daily charts or monthly etc… The default is for Daily but you can also add Weekly, or Monthly to specify the desired data (not sure if Hourly works but worth a shot if you think you need it).
Example: [monthly RSI(14) >70]
PUTTING IT ALL TOGETHER
So taking what we just learned, let’s put together a simple stock scan that will search for US stocks listed on the NASDAQ or the New York Stock Exchange that have an RSI under 40:
// This scan searches for stocks on the NASDAQ or NYSE with an RSI under 40
and [type = stock]
and [country is US]
and [[exchange is NASD] or [exchange is NYSE]]
and [RSI(14) <40]
Notice the first line in the above code is an example of using // as a Note.
See how the description and code read very similar? When starting out, try writing in just normal words what you want your scan to do and then figure out what codes those words translate to :)
Here’s another good one. This code searches for undervalued Large Cap stocks from the US whose price is under the 200 SMA:
[type is stock]
and [country is US]
and [market cap >=10,000]
and [today’s close <today’s SMA(200)]
*NOTE: Market Cap’s value entry represents millions — so 10,000 million is $10B — If too many results show up, try upping it to 100,000 ($100B) or adding in specific exchanges to limit the search.
CHECK YOUR WORK
At the bottom you’ll notice a Check Syntax button, this will look for errors in your code like a missing bracket or misspelled word etc… It will show you warning for lines with errors in the code.
Helpful Links About Coding:

This should be enough to get you started with Scans and Alerts. There’s SO MUCH MORE you can do than what I listed, this is just scratching the surface. Again, if you come up with some masterful code for Scans/Alerts, please share it in the comments. Would love to see what everyone comes up with!
And for those of you who read this far, I have a special reward for you. You can download my current (as of today) MASTER WATCHLIST by clicking HERE. As always, it’s completely FREE! You can then import it into Stocktrades and start testing out the Scans and Alerts from this post. Enjoy!
If you don’t already use Stockchart.com please CLICK HERE to use my referral
Trade long and prosper!
🖖