CASE STUDY: What to do with $1,000 to Trade 🤔

You spend enough time reading the comments of financial influencer’s posts you’ll start to see a the same question posed over and over again:
If you had $1,000 to invest/trade what would YOU do?
Most of the posts you see those comments on are by influencers showing off the “millions” they’ve made using their system of trading. They often make promises about how buying their classes can make you $100-$200 a day or more — But for those starting out it can seem like getting to a million when starting with next to nothing will never happen in this lifetime, so they ask what that person would do with $1,000. But asking a rich person what they would do with basically pennies will never yield a great answer. Some of these people can lost more in a day that you make all month and it doesn’t phase them. You can’t compare yourself to them, especially when most influencers are faking it (to get you to shell out your money) so they can make it.
So with this post I want to take a look at a real world example of a successful swing trade and the realistic gains one could make. Just a reminder that these posts are NOT financial advice, just me walking you through a paper trade one of my stock picks with a fictional $1,000* to invest in a single trade.
*Now, it’s important to note is that you should never put ALL of your capital into a single trade. So for this case study, we’ll assume our total bank roll is $10k of which we are looking to put 10% of it ($1,000) to work on a single trade.
This post will assume you know how to read a stock chart, so knowing what Moving Averages are and the difference between Simple and Exponential, can recognize levels of Support and Resistance, and know what things like RSI (Relative Strength Index) and ATR (Average True Range) are. If this all sounds like Greek to you, READ THIS POST FIRST!
Finding a Good Stock Pick
They always say if someone at the gym or work is telling you about a good stock pick, chances are you’ve already missed out and it’s already ran it’s course and is getting exhausted. So then how do you find a good stock with over 2,500 in the NASDAQ and 500 in the S&P (and not to mention the OTC stock)? As I’ve mentioned before, stock picks are all around you! Are you reading this article on your phone or computer? Which brand is it — Apple, Google, Samsung, Nokia? Who is your provider —Verizon, AT&T, Spectrum, T-Mobile? What kind of car do you drive? What gas station do you fill up at? All of these are owned by companies who have stock.
For more on finding good stock picks, read my previous post HERE.

For this post, I’ll be using a setup I found back in April. The stock is for an energy drink company called Celsius ($CELH). How did I find it you ask? — My girlfriend. She drank the stuff and had been drinking it and talking about it for a while, back when it was hard to find even. She’d always tell me she saw a co-worker of hers drinking it after she recommended it. And now they stuff was everywhere — and it’s true, you can even buy a case of it now at CostCo ($COST by the way).

So after her talking about it over and over, I decided to look up and see if it had a stock (I literally just Googled “Celsius drink stock). What I found was a very nice setup, which I screenshot and drew a quick analysis on to send to my girlfriend:

As you can see in the chart above, $CELH is in a Stage 1 setup:
- It has at least 4 bars (read: days) of support
- The 5 EMA is below the 20 SMA
- Price is below the 200 SMA (a “bread and butter” trade)
Quick refresher on the Four Stages of Price Movement:

Price moves one of THREE ways:
- UP — Stage 2 which is an uptrend
- DOWN — Stage 4 which is a decline or downtrend
- SIDEWAYS — Stage 1 & Stage 3 are really the same, you don’t know which one it really is until it breaks out to the upside or the downside
Follow Gerald Peters @fullauto11 on Twitter and Instagram. For FREE lessons on how this all works, watch his weekly Sunday Services on YouTube where he covers all this and looks at some of his picks for the coming week as well as checks in on how his previous picks are doing.
Take another look at that screenshot, you can see the Four Stages laid out perfectly:

For more on the Four Stages of Price Movement read my previous post HERE.
One MAJOR thing to remember…
When looking for a good setup, looks at the % of the gain not the $ amount. For example, you might see a chart for Stock A that’s only $10 per share and the target is $11 and then see Stock B that’s $125 per share with a $135 Target— you might think, “Eh, my time isn’t worth it for $1 of profit with Stock A. I’ll go with Stock B and make 10x more!” But that’s the completely wrong frame a mind. That $1 gain for Stock A is a 10% gain whereas the $10 gain for Stock B is only 8%. So remember, always look at potential gain moves in percents not dollar.
Risk Management
For those who can tolerate more Risk, they could take a partial position in a Stage 1 one like this. For those who need to be more cautious and want to their Risk more, they could wait for the Stage 1 Breakout. For those wanting to be even MORE cautious, they could wait for the Stage 2 Breakout. We’ll go over those again in a minute, but first let’s talk about how to calculate the amount of Risk you can afford to take.
The 2% Rule
The rule most successful investors/traders seem to generally follow is this:
Neve risk more than 2% of your available capital on a single trade.
Now you may be thinking, wait, wait, wait, wait, wait, wait! — Isn’t 2% of $1,000 only $20??!! How the hell am I supposed to make any money if I’m only allowed to trade with $20?!
The good news is, your math is right! The bad news is, you calculated your risk incorrectly. But the even better news is you’re about to learn how to actually calculate how much you’re risking on a trade…
First off, our total capital is $10k, we’re only putting $1,000 into this trade. So therefore, our total risk per trade is $200!
But wait, $200 is still not $1,000!! How will I make any money if I’m only now putting in $200??? We’ll be putting in the full $1,000 BUT only risking $200 of it. But how you ask? First let’s clarify something:
If you invested $1,000 in Stock X, you would essentially be at rick of losing $1,000 right? Teeeeechnically, yes, if it goes to ZERO. Buuuuuut if it’s a decent company (i.e. not a penny stock or junk stock) the chances of it going to zero OVERNIGHT are pretty slim (but never impossible). I mean, if you saw your stock dropping, you would probably sell to at least walk away with SOME money, right? So really, if thee stock drops, you’re only risking whatever the difference is between your BUY and your SELL price.
Now let’s say you watched the price of your holdings go from $1,000 all way down to $500 before you sold. That would mean you risked $1,000 and lost $500 for a 50% Loss. As you watched the price fall and it became more and more painful, eventually you hit a point where you gave up hope, called “uncle,” caved to the momentum and took the L. That point, where it was “all you can stand and you can’t stand no more” is your tolerance. Now, I overstated this to make a point, hopefully you’re not take 50% losses in the real world, but if you’re being smart about your moves you shouldn’t be taking them. In fact, you should know how much you can tolerate in advance, but lucky for you, we already covered that. The answer is 2% per trade!
So, back to that 2% thing — Yes, 2% of $10k is $200. So how does one ensure they’re not risking more than $200 on a trade? Easy, you set a Stop Loss order so that your position automatically sells if it goes down to a $200 Loss.
A Stop Loss is a sell order placed on a stock (say in your online trading account) so that if the price drops to or below that price it will automatically trigger a sale and prevent you from taking a greater loss.
Think of a Stop Loss as a safety net! With a safety net in place that works automatically, you don’t have to sit and watch your stocks the entire trading day — as the infomercial saying goes, “Set it and Forget it!”

Take a look at that $CELH chart again:
You can see the last 4–5 days have found Support at around $48. If the price goes below that aka BREAKS Support. You’ll wanna sell and get the hell out of dodge because it’s most likely (again, most likely, not guaranteed) going down to test the next Support level.
The difference between the Current Price (let’s say $52 for easier math) and your predetermined SELL PRICE which is the Support Level price (let’s say an even $48) isa total of $4 your risking per stock.
*NOTE: Another way to do this is look at the ATR (Average True Range) indicator which charts the current amount the price should fluctuate in a day. The ATR is not in the phone screenshot chart but it’ll be on the full charts later in the post.
So if your goal is to put no more than $200 (again 2% of your TOTAL capital) at risk on a single trade, and the risk of this trade is $4 per stock, you could technically buy 50 shares with that Stop Loss
$200 / $4 = 50 shares
— but 50 shares at $52 would cost $2,600 and since we are only putting up $1,000 for this trade… we can buy a max of 19 but let’s say 20 shares for simplicity and with a Stop Loss set at $48 we are only risking about $80 which is only 0.8% Risk, way under our 2% goal! Look at us being all responsible like :)
For more on Risk Management check out my previous post HERE.
Okay, now that we’ve successfully managed our Risk on this trade, let’s take a look at those sweet, sweet gains!
SCALING IN and TARGETS
So you’ve found a trade so you should just throw all your money at immediately before it’s too late, right? WRONG.

The reason we don’t want to go all in at once is we want to both get a good price
Note: Aim for good, not the best. Trying to buy at the absolute bottoms and sell at the absolute tops is a recipe for failure. The goal is to be successful not greedy. We would rather have 20 solid first base hits than 19 strike outs and 1 home run.
SCALING IN
Buying at different prices as the trade moves in your favor is called “scaling in.” As discussed in other posts, there are 3 good points to enter a trade:
- Stage 1 — When there are at least 4 days/bars of Support and the 5 EMA is below the 20 SMA. This is the riskiest entry point but also offers a higher gain since you’re getting in at a lower price.
- Stage 1 Breakout — When the price closes above the 20 SMA that’s a sign that the momentum is moving to the upside. This is the medium risk point — less risk but also slightly less reward.
- Stage 2 Breakout — When the 5 EMA crosses above the 20 SMA the trade is making a big move to the upside. This is the lowest entry point of this swing trade but also closer to the Target Price so the reward aka gains are smaller.
Now depending on your personal decisions you can use all, some, or even just one of these entry points to scale in. Could be 7 shares, 7 shares, and 6 shares at each point respectively. Or 10 and 10 etc… Whatever fits your personal trading strategy.
Most people will immediately say, “Well, I want to get in at the best price possible, I’m only going to do Stage 1s.” But if you go all in at a Stage 1 that never breaks out and price drops, triggering your Stop Loss, you’re out $80 on this trade. Whereas if you only did say half at a Stage 1 and half at the Stage 1 breakout, you only lose $40 if the S/L triggers. Even less if you’re doing 7 shares at the Stage 1…
When you scale in (or out) you are also that you are Dollar Cost Averaging (DCAing). This means you take you calculate the general price you paid per share rather than try to track all the shares at different prices. For example:
Let’s say you bought 10 shares at $10 ($100 total), 5 shares at $12 ($60), and 5 shares at $15 ($75). Then sell them all at $20. Rather than calculate the gains for each individual price point, you can just add up the total 20 shares for $235 which averages out to $11.75 per share, for a total profit of $8.25 a share or $165 ($400-$235=$165). That simplified tracking/calculating is DCAing. Now sure, we’d have made more money ($35 more) if we went all in at the $10 price point with all 20 shares but as mentioned earlier, if the trade went the other way the loss would’ve been greater. And remember, $165 is still a damn good profit!
Don’t fall for the trap of not DCAing up — some people get shortsighted thinking, “Well, I just got shares for $10, I’m not gonna buy at a higher price now.” But if your analysis shows the stock is headed toward $20, why wouldn’t you buy at $12 and $15? — Profit is profit!
TARGETS
Finding a good setup isn’t very useful unless you know when to exit and take profits. That’s the difference between swing trading and investing —
Swing trades are positions involving riding short term moves to earn profits in a matter of days, weeks, or months. (*Not to be confused with the riskier Day Trading strategy which moves in a matter of minutes or hours)
Investments are more buy and hold positions, where you find a promising new company or an undervalued older one and put your money in that position for the long haul over a matter of years.
These are two very different strategies requiring different mindsets. This post is just an example of swing trading.
Just like scaling into a position, you want to scale out of a position as well. The reason for this is in case a position continues to rise you want to still be in the position, BUT you want to remember to take some profits along the way. Why? Because that’s the whole point of trading! Being greedy will only land you in trouble. So how does one know when to take profits and exit a position?
There are a few signs for exit points of a trade. We already talked about the Stop Loss which is the exit point when the trade goes the wrong way, but let’s look at the exit points when the trade does go in your way:
- When price reaches a predetermined Target price
- When the stock gets overbought and the Relative Strength Index (RSI) hits 70
- When Price closes below the 20 SMA
- When the 5 EMA crosses below the 20 SMA
For more in-depth explanation of Planning your Exit, read my previous post HERE.
In the screenshot you can see my crude marks of rough Targets for the $CELH position:
The First Target is in at the previous Resistance level in the low $60s as indicated by the blue line. At the current $52 price you’re looking at an $8 gain, which doesn’t seem like much but actually amounts to a 15% return — seeing as you can expect an 8–10% from an S&P ETF, which is a great return, this trade is looking stellar!
Now the reason you want to scale out rather than sell all of it at the first target is that the trade might keep running and offer up more gains! You’d be kicking yourself if you weren’t still part of it. (The same goes for Stop Losses, you might only want to pull out a portion of you position in case it’s a false decline and ricochets back up — that’s up to you and your Risk Tolerance).
One of the biggest lessons you need to drill into your head is:
NEVER GET UPSET ABOUT LEAVING MONEY ON THE TABLE!
Be happy with the gains you got. A successful trade is a successful trade, we’re not trying to squeeze every penny out of a trade. This is why in the above chat it’s better to set your First Target at a price that is more likely to hit ($60 or so) instead of the very max ceiling ($61.99).
So for your first target you may want to sell 1/4 or 1/3 of your position, whatever is part of your personal trading plan. (We’ll discuss more about automating these moves later in the post).
Let’s take a look at the next Target. This can simply be the next Resistance Level or in this case, the 200 SMA, which is the average price from the past year (which is 200 trading days- that’s why we use that number). In this case it’s about $70, which equates to $18 or about 35% gain from our original $52 entry point.
Another signal for exiting a trade is using the indicators to determine when the trade is losing momentum and becoming Overbought. In this case we’ll be keeping an eye on the Relative Strength Index or RSI — If the RSI is Under 30 it means the stock is oversold (which is a great time to buy quality stocks) and if it’s Over 70 it means it’s overbought.
This is a good moment to point out that when you’re trading, while you may be purchasing the stocks of a company, what you’re really doing is trying to ascertain is what is the cumulative mental state or thought process of all the other traders, THAT is what moves a stock price. Researching the P&L numbers and company’s Earning Reports etc… is all to try and figure out how every other trader is looking at the same data and what their next moves will be and hoping you’ll make the smart moves before everyone else.
Let’s take a look at a random chart’s RSI, it doesn’t matter which stock it is, it’s just to display how the RSI indicator can be used to signal trend reversals:

The RSI Indicator is at the top. There are 2 solid horizontal lines as mentioned (the 30 level at the bottom and the 70 level at the top). The indicator line is a graph of each days RSI value plotted on a chart. And the green filled in parts are when the RSI enters the oversold (below 30) or overbought (above 70) zones.
As you can see from the chart, when the RSI crosses into these zones it signals that the current trend is about to reverse — and looking at the price movement following each occurrence, you’ll see that’s precisely the case. Therefore, when a stock’s RSI nears 70, it’s a good time to take some profits.
Again, you may want to sell 1/4 or 1/3 of your position, whatever is part of your personal trading plan. While this cannot be fully automated with a Sell Order, you can use Alerts to let you know when a stock is approaching these zones.
The last two exit points are the exact inverse of our BUY indicators. Remember we said a good time to get into a position was when price closes above the 20 SMA and when the 5 EMA crosses above the 20? Well, a sign the trade is exhausted and it’s going to fully reverse is when price closes below the 20 SMA — a Stage 3 Breakdown, and the 5 EMA crosses below the 20 SMA— a Stage 4 Decline.

As you can see, the Stage 3 Breakdown happens right before the Stage 4 Decline where the trade reverses to the downside.
BUT take notice of that the Stage 3 Breakdown in April — see how the 5 EMA didn’t cross below the 20 SMA but rather bounced off it after finding 4 days of Support — this is why you want to scale out and keep even a small portion of your position because right after that it rips even higher.
Okay, so now you know:
1) How to find a stock (look at products, services, companies, around you)
2) How to spot a good setup (find Stage 1s with at least 4 bars of Support and the 5 EMA under the 20 SMA — with those lines moving closer together)
3) How to scale in at various entry points (Stage 1, Stage 1 Breakout, Stage 2 Breakout)
4) How to identify your Target exit price to take gains (previous Resistance levels, nearing 70 RSI, or Stage 3 Breakdown)
Let’s run through this strategy as a $1,000 paper trade over the past few months since that first screenshot in April.
Paper Trade: $CELH
As we’ve mentioned, this paper trade will assume we have a $10,000 account and plan to put 10% of that into a single trade ($1,000) and not risk more than 2% of our account ($200) on any one trade — which given this stock’s current price of $52, allows us to purchase 19 shares (but we’ll say 20 for simplicity sake). Again, this will all vary based on an individual’s trading strategy and financial plan.
We’ve also discussed that one’s strategy can be customized based on your risk tolerance, here are just a few example variations:
- Trade A — Buying 7 at Stage 1, 7 at Stage 1 Breakout and 6 at the Stage 2 breakout
- Trade B — Buying 10 at Stage 1 and 10 at the Stage 1 Breakout
- Trade C — Buying all 20 at Stage 1
For this paper trade we’ll keep it simple and only buy at the Stage 1 Breakouts when the Price Closes Above the 20 SMA.
Also, I’ll be using today’s chart but blocking out the info we wouldn’t see if making the trade in real time — there’s a saying, “We can only see the left side of the chart” which basically means we can only see the past not the future.
Okay so let’s do this!
So you get a hot tip from your girlfriend about this energy drink that she loves called Celsius. You Google “Celsius drink stock” and find $CELH with the above chart with a very nice setup. Your trading plan is to only enter at Stage 1 Breakouts where the price closes above the 20 SMA, so… you wait…

Finally, 6 days later, on April 19th, price closes above the 20 SMA. So you put in an order at market opening the next morning to buy 18 shares at $56.53 (18 not 20 because while waiting for the Stage 1 Breakout the price went up — now you see why some people would want to DCA in or take the riskier Stage 1 position).
So now you have 18 shares which cost $1,017.54 (close enough to our $1,000 budget).
Next, step is to set your Exit Points, both your Stop Loss and your Sell Orders.

- Based off previous Support, you set your Stop Loss at $50
- Looking at previous Resistance, you set your 1st Target at $60
- Based on the 200 SMA, you note that your 2nd Target will be $70
So you put in a Contingent Order — OCO or One Cancels Other (we’ll cover how to automate this with OCO orders later in the post) — to sell 10 shares if the price drops to $50 or if the price rises to $60. Let’s see what happens…

The price consolidates (aka moves sideways) for a few weeks but then on May 5th, price drops and triggers the Stop Loss.
You now have 8 shares of $CELH left and $500 back in your account as well as a $65.30 loss on your books for this position.
Price continues to fall all the way down to $38.31 but you hold on to your remaining 8 shares and right after the drop, price bounces back up and on the 13th price again closes above the 20 SMA at $56.38.

At Monday morning you put in a buy order with your $500 for 9 shares at $55 which fills that day. Now you have 17 shares with a DCA price of $55.72 (currently worth $947.24), $5 cash in your trading account, and a $65.30 loss on the books.
At this point your 1st Target is already within the normal price move of that day, so you instead set your sell order for your 2nd Target of the 200 SMA which is $70 and your Stop Loss is again at $50.
So you set an OCO order for 10 shares to sell at $70 or to stop loss at $50. And again you wait…
The on May 27th one of these prices triggers the OCO order…

Lucky for you it’s the $70 sell order!
You now have 7 shares of $CELH (DCA price $55.72 per share) and $705 in your trading account, and a $77.50 gain on the books ($142.80 from this sell order minus the $65.30 loss from the earlier triggered Stop Loss).
Now that the price has broken through the previous Resistance, that old Resistance level becomes the new Support level. In order to protect our gains, we will now be setting the Stop Loss for our remaining shares at this new Support level. But where do we set our next Target since there’s no higher price showing on the current chart. There are two answers:
- A level of 70 RSI, which is now not too far off
- We look back farther on the chart to see if price has had previous Support and Resistance near these levels:

Voilà! We now have the next three levels of previous Support/Resistance.
So now we set our OCO order for 4 shares at a $66 Stop Loss and a Target of $75, and again we wait…
NOTE: If you’re worried about normal price fluctuation with your Stops, you can always set them lower at your Break Even Point which is your Entry Price (or DCA price). To determine how close you are in terms of normal price movement, see the ATR (indicator at the very bottom of the chart). Here it’s about $5.30 (the numbers on the left are covered in this image).

On June 10th your Stop Loss triggers on the 4 shares and sell at the open for $63.59 ($254.36 total which is $31.48 in profit).
You currently have 3 shares of $CELH (DCA price $55.72 per share) and $959.36 in your trading account for a total value of $1,126.52 which is about 12.7% profit — Not a bad return for 2 months considering most investors aim for 8–10% PER YEAR!
But the trade isn’t over, you still have 3 shares in the game but the price is dropping and drops even more and by end of day it closes below the 20 SMA. And when it does that, we scale out, so the next trading day we sell at open for $58.44 — a whopping $8.16 profit, but hey, like I said — “Profit is profit!” The money doesn’t care where it came from. Remember that.
You now have closed out the position and have $1,301.84 in your trading account for a total profit of 30%!! That’s 3x what investors aim to make in a year!
Now, $300 might not seem like a lot of money for two the course of two months, but remember that the Stock Market is fractal, which means it works the same on a bigger scale. So had you invested $10,000 instead of $1,000 you would still have a 30% gain which is now $3,000 in profits. If it was $100,000 it’s still 30% so $30,000 — Do you see how this works? As your account grows so will your gains (but remember, it goes the same for losses too).
You had a great trade and are reveling in your victory, which got off to a rocky start with that Stop Loss triggering right away, but ultimately made you impressive gains.
And over the next few days you watch $CELH out of morbid curiosity to see where it goes and pat yourself on the back for both setting that Stop Loss as well as exiting when the price closed below the 20 SMA because it kept you from dropping down to the break even point or lower. But as the days move on you notice something — $CELH is finding Support again…

Hey, there’s something VERY familiar about this chart — in fact, you think you’ve seen it before. And you have:
$CELH is back at the spot where it was when you first found the trade on that fateful day 2 months ago when you listened to your girlfriend’s inadvertent stock tip.
You remember learning to continually watch stocks so you learn their behavior and the very important fact that “price has memory.” You decide to get back into the trade because:
- It’s found 4 or more days of Support
- The 5 EMA is below the 20 SMA
- Price has memory — it’s been here before, you think you know where it’ll go
So you wait for the Stage 1 Breakout (since this is the strategy we’ve chosen for this paper trade case study).

And you don’t have to wait long because two days later it rockets up and closes above the 20 SMA. So the next morning you buy in at $64.99 and get 20 shares because remember — you have $1,301.84 in your trading account for this trade right now. See again how you can start to grow your account and therefore your possible gains?
Since we’re at the same levels as before, you set your Stop Loss again at $50 and your Target to $71.50 (we bump it up a little bit since we just saw it reach over $72 and price has memory so there’s a good chance it’ll go there again (the more risk averse can keep it at $70 if they’d like and the risk takers can use the same $75 target we had last time we were at this level).
We have a bigger position and put up about a third of it into an OCO order — so 7 shares at the $50 SL and $71.50 Target. And again, we wait…

The stock consolidates for a few days but then right after the 4th of July holiday, then launches like a rocket to a high of $75.71 eventually closing at $75.04 and your target price of $71.50 is easily triggered. The important thing here is to not lament over the fact that you missed out on and extra profit of $4/share*. That doesn’t matter because:
- It was a successful trade that went perfectly as planned.
- Profit is profit. You don’t stress about leaving money on the table.
- You still have 13 shares in the position!
*but if you did go with the riskier move and set the target price we set last time at this level, you would’ve hit the $75 target — this was based off the older price data, which again… has memory!
Now you have $500.50 in your trading account and 13 shares of $CELH worth $975.52 for a total worth of $1,476.02 which is a 47.6% gain from your original $1,000! HOLY CRAP THAT’S ALMOST FIFTY PERCENT!!

So the next thing we is immediately set our next S/L and Target. Again, looking at that chart with the older past data which went higher than where we currently are we see:

Our Target is around $85 and we pull up our Stop as well. Since the previous move was so big so quick, we don’t want to set it just yet in case it immediately gaps down back into the normal range. Sometimes these rockets or plummets are just a small surge. Today’s move was out of the normal ATR, so best to play it safe so as not to get stopped out too early. This would be a good instance to just move are S/L up to the Break Even / Entry Price of $64.99. We’ll put another third (7 shares) into an OCO order for $64.99 S/L and an $85 Target. Once again, you play the waiting game…
There are some hairy days where it seems to gap back down but that doesn’t last long (and doesn’t trigger your Break Even S/L!). It bounces off the 70 RSI line but never crosses above it.

And then on July 21st it just passes above your $85 Target and your order triggers selling for $595 which is another $140.07 in your pocket.
Now you have $1,095.50 in your trading account and at close have 6 shares of $CELH (currently worth $510.48) for a grand total of $1605.98 from your original $1,000 is a 60% profit in about 3 months.
Again, we consult the chart. RSI is still under 70. Price is moving up with momentum still. the 5 EMA is well above the 20 SMA. And our previous Support and Resistance tell us what the S/L should be:

Next Target is around $100 (or if the RSI goes above 70) and the next S/L is pretty close to the current price so we’ll use the ATR price which is $5.55 — we’ll go with $6 to give some breathing room — which make the S/L price $79.08 ($85.08 close price minus the $6 ATR range).
NOTE: For situation where you’re heavy into profit like this or there is not enough previous data to set a Resistance Target, you can choose to set a price slightly higher than the ATR as a Trailing Stop Loss. A trailing stop loss is a percent or dollar amount that adjusts automatically as the price of the stock increases — so if a Stock is at $10 and you have a $2 trailing stop and the stock rises to $20 your stop is pulled up to $18 but when it drops below that $18 it will not adjust (that would defeat the point) but will sell for that amount. You don’t want to set trailing stops too tight as normal price movement can shake you out of the trade, which is why a value higher than the ATR can work well.
So now the OCO order is set for 3 shares at a $79.08 S/L with a $100 Target.
Your trading account currently is above break even at $1,095.50 and your six shares of $CELH are currently worth $510.48.
That would have been your account last Thursday if you got into the trade back in April (I was posting about it a while ago on Twitter as you can see below). You could’ve made 50% gains in 3 months. Not bad for a bear market/ and impending recession. Sure that’s not the $100–200/day the Financial Influencers are trying to sell you, but it’s real. You just followed it step-by-step, move-by-move for FREE! (Again, NOT financial advice, just for educational purposes only).
And remember, this is all fractal, so it works the same on a bigger scale. So this trade would have given you 50% returns on $1,000 or $100,000 .
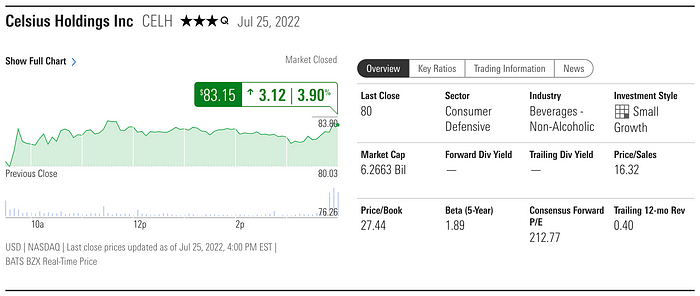
Not to mention, this trade is still active and the stock is currently at $83.15…

There have also been rumors floating around that PepsiCo ($PEP) might buy Celsius ($CELH) after it’s deal with Bang recently fell apart. And the data from TipRanks and Morningstar indicates that analysts believe there are more gains to be had:


All of this indicates there could be more gains to be had, but even if there is not, you aren’t stressing because you have 3 shares with a STOP LOSS protecting your gains and 3 more in your core position in case the stop triggers but the you want to stay in the trade until the price closes below the 20 SMA again — and I say again because it WILL happen. The stock market is ups AND downs. Nothing goes up forever, although over time the majority go up, which is great for investors, but swing traders want to ride that up and down movement. As you just saw, it’s VERY fruitful and can be quite predictable because… Price has memory!
Oh and the moral of the story is: Alway listen to your significant other 😜

UPDATE
On August 1st, your final six shares you set at a $100 Target with a $5.55 trailing Stop Loss hit and closed out your position yielding $204.06 more gains:

We started this trade with $1,000 and exited it with $1,491.44
That’s a profit of 49%!!!
I know what you’re thinking,“I shouldn’t have sold, what if it goes higher?!”
Who cares?!! The goal was to swing trade and make a profit. You basically made 50% which is over 5x the YEARLY expected return of the S&P’s 8–10% so be happy with your trade. (Not to mention that RSI is at nearly 80 meaning the trade is getting exhausted).
Now it’s time to roll those gains into a new trad and ego out and find the next setup. And slowly but surely, your account with grow and you can take bigger positions. This is how real traders grow their accounts. Not with those $100–$200 a day gains those YouTube influencers promise if you buy their secret trading system. Most of those people get rich off viewer’s desperation, not smart moves trading.
That’s why I post these lessons for free. It’s better you use that money to buy stocks than snake oil online courses.

Also, don’t forget to keep an eye on $CELH still. As I mentioned, the RSI is nearly 80 so the trade will likely pull back. You’ll want to keep track for when the stock sets up with a nice Stage 1 again, and since you’ve already traded it before, you know it’s behaviors and can make quicker and smarter decisions than you did the first go around.
Automating Your Trades
You can automate 2 parts of your trading fairly easily:
- Searching for good stock setups using stock scanners and alerts.
- Placing your both your Stop Loss and target Sell Order using the OCO feature of your brokerage account.
OCO Orders (One Cancels Other) — A conditional order in which two orders are placed, and one order is canceled when the other order is filled.
There are a lot of options out there for brokers and for stock scanning software (some free, some paid). I only cover the stockchart.com Scan & Alerts tools and show how to set an OCO order on Fidelity or TD Ameritrade.
Homework
- Go back through this trade and paper trade it using one of the other trading plans (or use your own) to see how it affects the gains:
- Trade A — Buying 7 at Stage 1, 7 at Stage 1 Breakout and 6 at the Stage 2 breakout
- Trade B — Buying 10 at Stage 1 and 10 at the Stage 1 Breakout
- Trade C — Buying all 20 at Stage 1
2. Find a stock setup — either by looking up companies and products you use everyday OR using a setup Scan — and paper trade it with a fictional $1,000 over the next few weeks or months. It’s best to practice on paper (or a spreadsheet) until you get the hang of it rather than losing real money and not having any money to trad with by the time you actually learn what you’re doing. (For the truly lazy, try $WBA or $KHC this week).
3. Attend Gerald Peters’ next Sunday Service for a Live Trading Lesson.

I hope this post was helpful on showing you how a small trade of $1,000 can grow if you have the patience and turn off your emotions and trust the charts.
If any of this was confusing or went way over your head, be sure to start at the beginning with this post HERE.
If you at all found this article helpful, feel free to buy me a coffee or two below as a thank you 😀☕
Have a great week, everybody. And good luck out there!
Trade long and prosper!
🖖

Sign Up for a Medium Membership: https://spocktradez.medium.com/membership